As 3D printing becomes more and more ubiquitous, computational methods must be developed to study its engineering properties. 3D printed materials are unique in that they have both a microstructure, with the properties of the raw material used in the print, and a macrostructure, defined by the selected printing pattern.
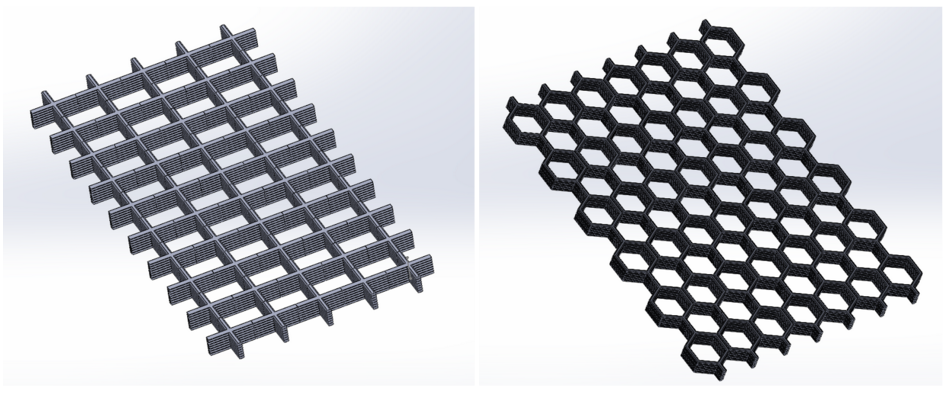
In this analysis, we characterize 3D printed materials with a square infill pattern and a hexagonal infill pattern. These structures are shown in the image below.
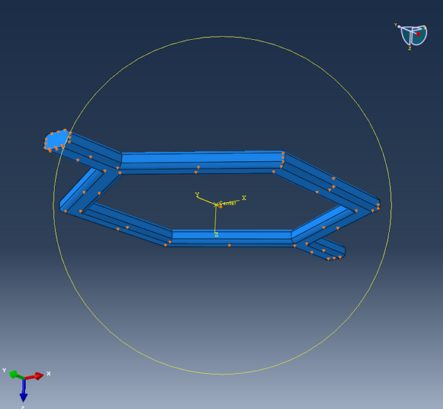
Analysis began by selecting a ‘unit cell’ for each infill pattern. A unit cell is any shape that can be patterned – both horizontally and vertically – to form the full structure. Thus, the properties of the unit cell define the properties of the entire structure.


We simulated layered printing in the square infill by making two different cross sections in the unit cell. We assumed each hex infill unit cell was printed completely in the same layer.
Next, we loaded our unit cells into Abaqus.
We applied strains both vertically and horizontally. We collected Young’s Modulus and Poisson’s ratio data. Our results are summarized below. The colors in the images of the deformed unit cells show the range of Mises stresses in the material.
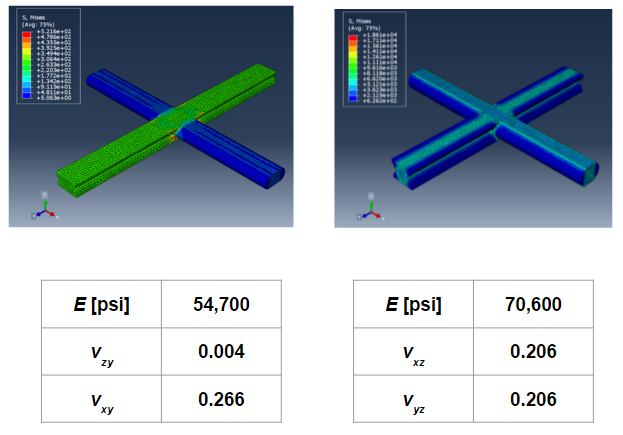
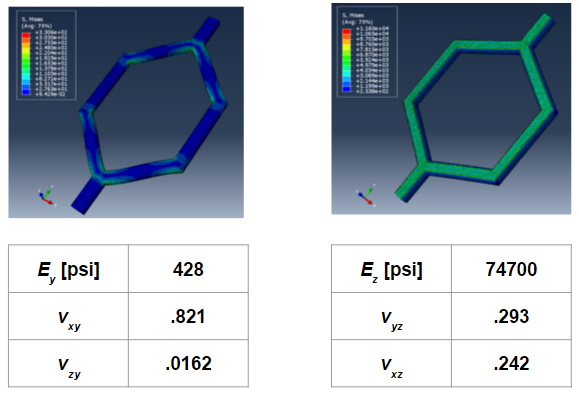
Both materials were much stiffer along the out-of-plane axis, and the square infill was two orders of magnitude stiffer than the hex infill along both in-plane axes.
Stresses concentrated at corners, hinting that a more sophisticated model of the bonding between layers may be warranted for a more accurate analysis.


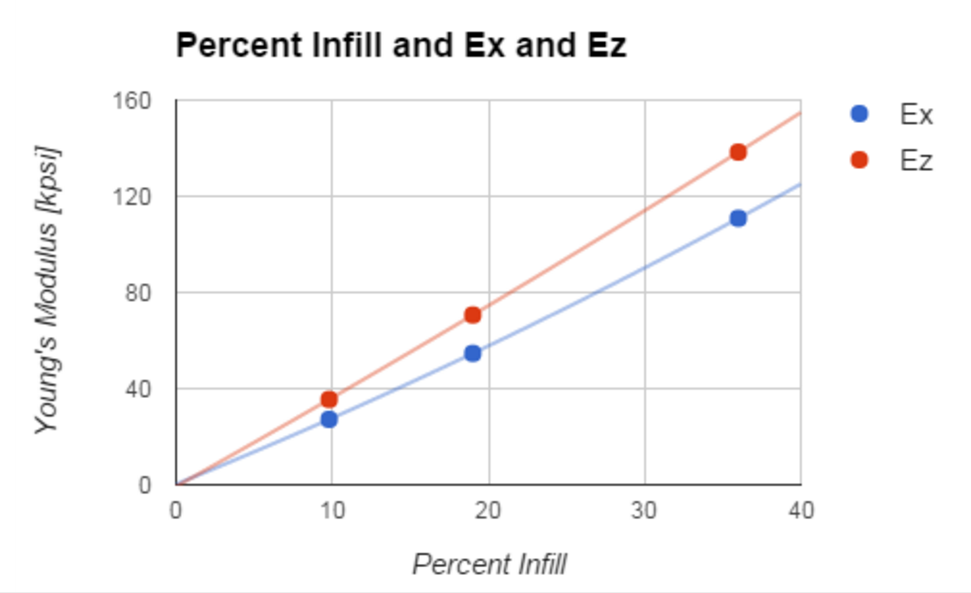
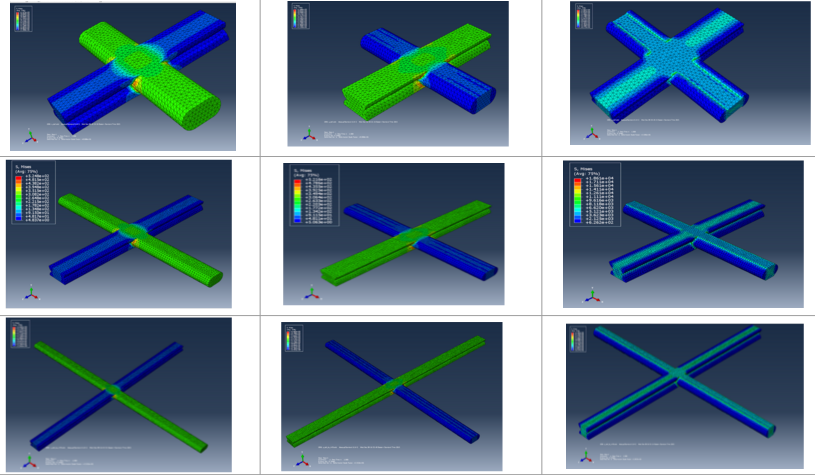
We continued our analysis by varying the percent infill in the square pattern. Percent infill is the amount of 3D printed material per volume. Deformation simulations collected for three different infill percentages is shown in the graphic below.
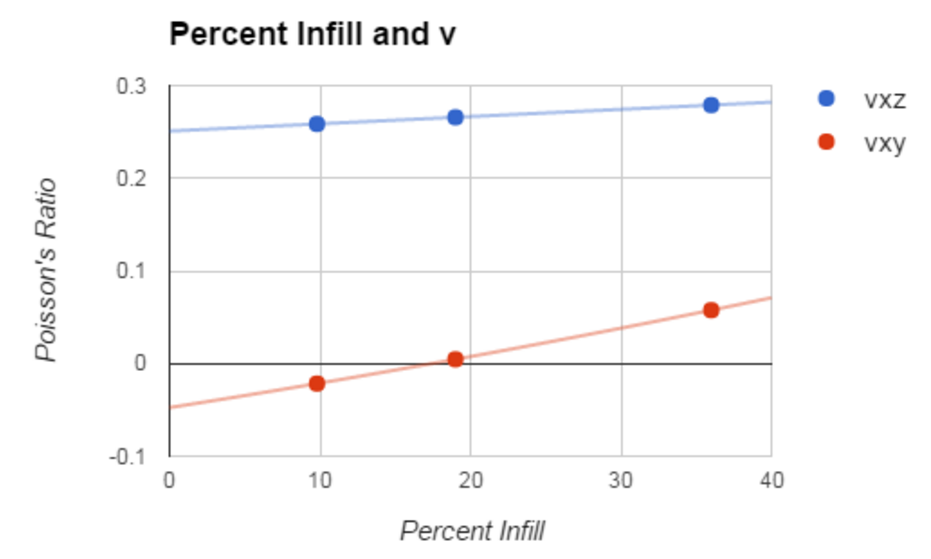
Quantitative results are summarized in these graphs. The first graph shows Young’s moduli in both in-plane directions. The second shows in-plane-in-plane (blue) and in-plane-out-of-plane (red) Poisson’s ratios. We managed to catch a negative Poisson’s ratio at the lowest infill percentage.